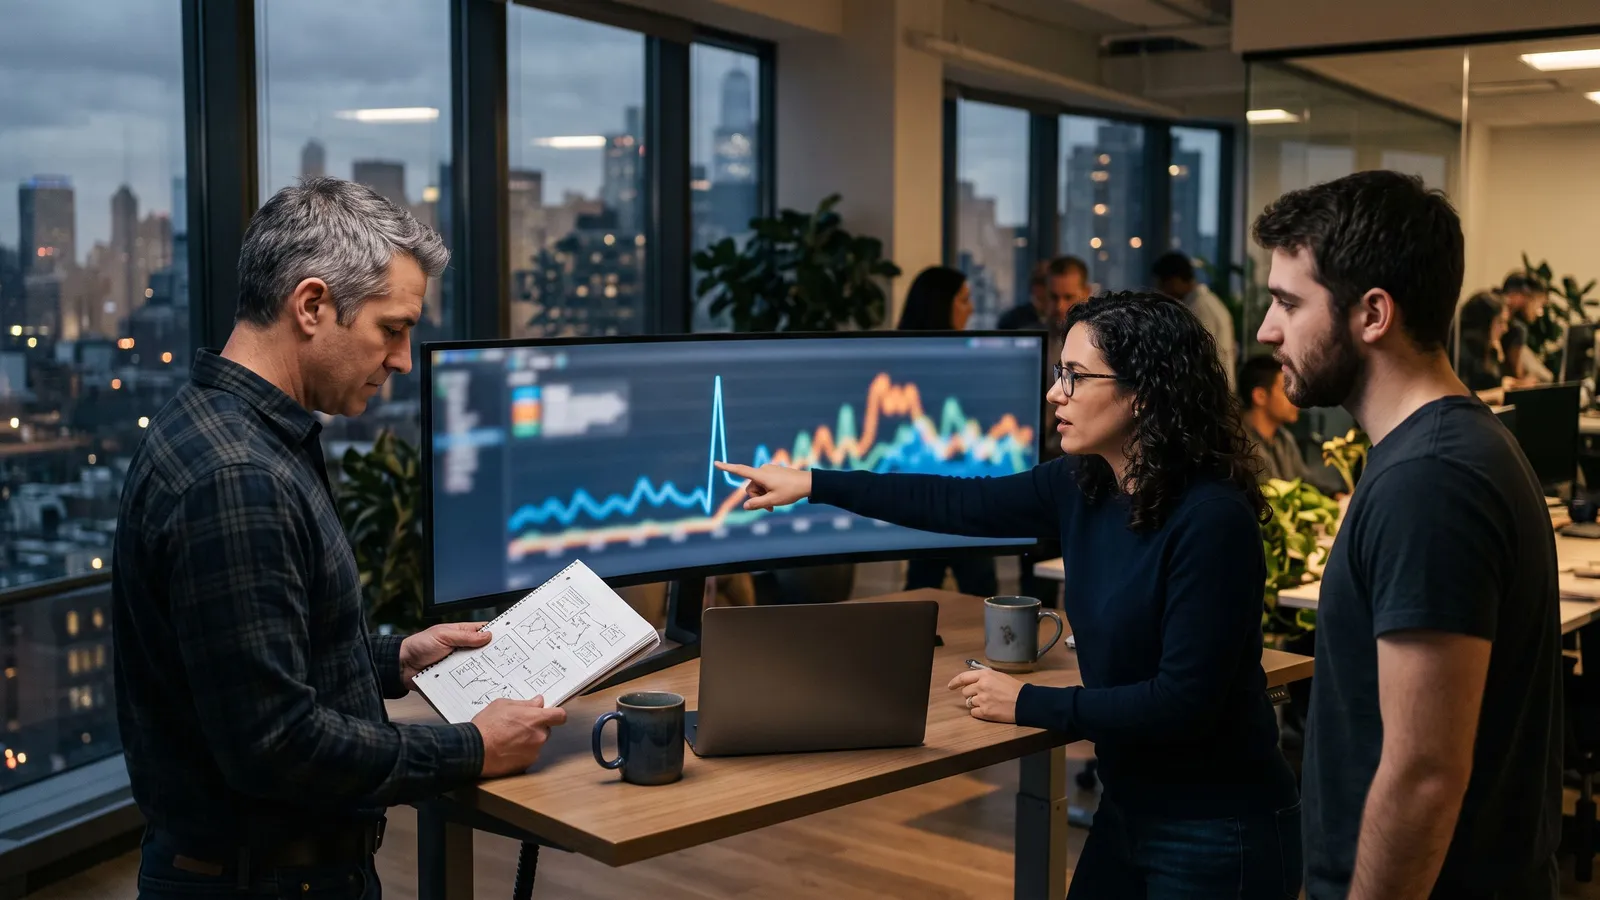
AI agent observability means recording every step an agent takes in production, each model call, tool call, input, output, cost and human override, as a connected trace you can search, alert on and replay. Uptime dashboards are not enough, because an agent can return a clean response while doing the wrong thing. Instrument with OpenTelemetry, alert on behavior and spend, put agents on an on-call rotation, and name one owner.
This guide is for VPs of Engineering moving agents from pilot to production as 2027 plans get locked. It covers runtime monitoring and operations. Permissions and prompt injection are covered in our AI agent security guide, and offline evaluation metrics are a separate topic.
Why AI agent observability matters once agents reach production
A production agent runs constantly, calls real systems and makes choices nobody reviews in the moment. When it fails, the failure rarely looks like an outage. It looks like a refund issued twice, a ticket closed with the wrong answer, or a loop that quietly burns tokens all weekend.
The market is moving the same way. On November 3, 2026, CrowdStrike announced its intent to acquire Fiddler, an AI observability company, to become part of its Falcon platform as Falcon Observe. CrowdStrike describes tracing agent decisions across the agent hierarchy, detecting behavioral drift and unintended actions, and tracing failures to the step responsible. The signal: agent monitoring is becoming part of the security and operations stack, not a side project.
For a plain definition to share with your team, see what AI observability is.
Next question: What does it take to build an agent that is ready for production?
What to log for every agent run
Treat each agent run like a request in a distributed system: one trace, many spans. You should be able to answer "what did the agent see, decide, do and spend" for any run in minutes. Capture these fields on every run:
- Run and session IDs. A trace ID per run and a conversation or session ID that ties multi-turn work together, plus the user or system that triggered it.
- Every step as a span. Each model call, retrieval, tool call and sub-agent invocation, with parent and child links so you can see the order and the branching.
- Tool calls in full. Tool name, arguments, result, status and duration.
- Inputs and outputs. Prompts, retrieved context and responses, stored under your data retention rules, with redaction for personal and regulated data.
- Versions. Model name, prompt or system instruction version, agent version, tool schema version and the config hash.
- Cost and latency. Input and output tokens per call, cost per run, time per step and end-to-end duration.
- Human touchpoints. Every approval, rejection, edit and override, who did it and when. Overrides are your best free signal of where the agent is wrong.
- Outcome. Did the run finish its task, hand off to a person, hit a limit or error out? Record the end state explicitly instead of inferring it later.
Store full content where policy allows and metadata everywhere.
Next question: How is AI observability different from regular application monitoring?
Use OpenTelemetry so your traces are not locked to one vendor
The vendor list will keep changing. Instrument once with OpenTelemetry and send the data wherever you want: your existing APM, a dedicated LLM tool or your warehouse.
OpenTelemetry now maintains semantic conventions for generative AI covering model inference, tool execution, retrieval, agent invocations, events and metrics, with provider pages for Anthropic, AWS Bedrock, Azure AI Inference and OpenAI, plus MCP. The agent spans spec defines operations such as create_agent and invoke_agent, and attributes such as gen_ai.agent.name, gen_ai.request.model, gen_ai.conversation.id and token usage fields. The tool execution spec covers tool name, call ID, arguments and results.
Two caveats matter for planning. First, these conventions are marked as Development status, so attribute names can still change; pin a version and budget time for upgrades. Second, capturing message content such as input messages and system instructions is opt-in in the spec, which is the right default. Decide content capture per flow with your security and legal teams instead of turning it on everywhere.
CrowdStrike notes Fiddler instruments agents through OpenTelemetry, with support for LangGraph, Amazon Bedrock, AWS Strands and Google ADK. Whatever tool you pick, confirm it accepts standard OpenTelemetry traces before you sign.
Next question: Who can instrument our agents with OpenTelemetry and run the pipeline?
Alert on behavior, not just uptime
Traditional alerts fire when a service is down or slow. Agents need alerts for when they are up, fast and wrong. Set thresholds from your own production baseline and tune from there; the table gives the shape of each alert, and the numbers have to come from your data.
Segment every alert by agent version, model and customer or tenant. Averages hide the one tenant whose integration just broke.
Next question: Which team should run monitoring and alerting for models in production?
Cost runaway: budgets, caps and kill switches
Agent cost is a per-run control problem, not a monthly bill problem. One bad deploy can turn a routine workflow into endless retries.
- Set a budget per run. Tokens, tool calls and wall-clock time. When a run hits any limit, stop it, record why and hand off to a person.
- Set a budget per tenant and per day. One customer's runaway workflow should not eat everyone's capacity.
- Build a kill switch per agent. A feature flag that disables the agent or forces human approval on every action, which on-call can flip without a deploy.
- Attribute cost. Tag every span with team, agent and feature so cost reviews end with an owner, not a shrug.
Next question: Who should we hire to own agent cost and reliability?
Incident response and on-call for agents
If an agent can change customer records, it belongs on an on-call rotation like any other production service. Agent incidents are often behavioral, so the runbook starts differently.
- Contain first. Flip the kill switch or force approval mode before debugging.
- Scope the blast radius. Query traces for every run since the suspected start, filtered by agent version and tool, and list the actions taken.
- Check what changed. Model version, prompt version, tool schema, retrieval index and upstream API. Your version fields make this a query instead of a guess.
- Fix the data, not just the agent. Reverse or correct the actions the agent took, and tell the affected teams or customers.
- Write the postmortem. Add the failed runs to your regression set and add the alert that would have caught it sooner.
Next question: Do we need DevOps engineers on the agent on-call rotation?
Replaying failed runs
The most useful thing good traces give you is replay. With the inputs, retrieved context, tool results and versions stored, an engineer can rerun a failed run against a fix and see whether the outcome changes.
Make replay safe. Replays should call mocked or recorded tool responses, never live write actions, and should run in a separate environment with its own credentials. Keep a library of failed runs and run it on every prompt, model or tool change. That turns production incidents into tests, which is the bridge between observability and AI agent testing.
Expect nondeterminism: judge a fix across several replays, not a single rerun.
Next question: How do failed production runs become regression tests?
Who owns agent observability on your team
Agents fall between teams. Without a named owner, dashboards get built and nobody looks at them. A practical split:
- Agent owner (one engineering lead per agent): owns behavior alerts, the runbook, the regression set and the weekly review of overrides and costly runs.
- Platform or MLOps: owns the OpenTelemetry pipeline, retention, the shared dashboards, budgets and kill switch tooling across all agents.
- Security: owns content capture rules, redaction, access to traces and alerts on sensitive tool use.
- Business owner: owns the definition of a good outcome and reviews quality trends monthly.
Write the owner into the launch checklist. No agent ships to production without a trace pipeline, a budget, a kill switch, an on-call name and a first set of behavior alerts.
Next question: What does a forward-deployed pod own once an agent ships?
How Ryz can help
Ryz AI pod teams are senior engineers who build and run agents inside your cloud and repos, on US business hours, with the tracing, alerts, budgets and runbooks described here built in from the first release. Pods have shipped an AI driver-support agent covering about 218,000 driver calls a year in three languages and AI fraud detection that has scored more than 244,000 invoices. If you need the operating side staffed, our MLOps services and senior MLOps engineers join your team, report to your leads and most ship in their first week. Senior engineers typically run $10,000 to $15,000 per engineer per month.
FAQ
What is AI agent observability?
Recording every step an agent takes in production, model and tool calls, inputs, outputs, versions, cost and overrides, as connected traces you can search, alert on and replay.
How is agent observability different from LLM evaluation?
Evaluation scores quality, usually on test sets before release or on samples. Observability is the runtime record and the alerts that tell you what is happening right now. They share data: failed production runs feed your evaluation and regression sets.
Should we use OpenTelemetry for AI agents?
Yes, in most cases. OpenTelemetry has generative AI semantic conventions for agent, model and tool spans, which lets you switch or combine back ends. The conventions are still in Development status, so pin a version and plan for updates.
What should trigger a page for an AI agent?
Sustained tool errors, spend spikes, runs hitting step or cost caps, unusual activity on sensitive tools and sharp changes in human override rates. Set thresholds from your own baseline traffic, not from a vendor default.